
Visceral vs. Subcutaneous Fat Reduction: 16-Week MRI Tracking Data
Examine 16-week clinical MRI and DEXA scan tracking data comparing visceral adipose tissue (VAT) vs. subcutaneous fat loss from progressive running programs.
Examine 16-week clinical MRI and DEXA scan tracking data comparing visceral adipose tissue (VAT) vs. subcutaneous fat loss from progressive running programs.
Discover the exact heart rate zones where maximal fat oxidation (FatMax) occurs based on metabolic cart studies, substrate crossover kinetics, and training adaptations.
Detailed indirect calorimetry breakdown of Excess Post-Exercise Oxygen Consumption (EPOC). Compare Zone 2 vs Zone 4 afterburn calories, duration, and metabolic mechanisms.
Explore laboratory metabolic chamber data comparing fasted vs. fed morning running, 24-hour fat oxidation rates, glycogen kinetics, and real-world weight loss impact.
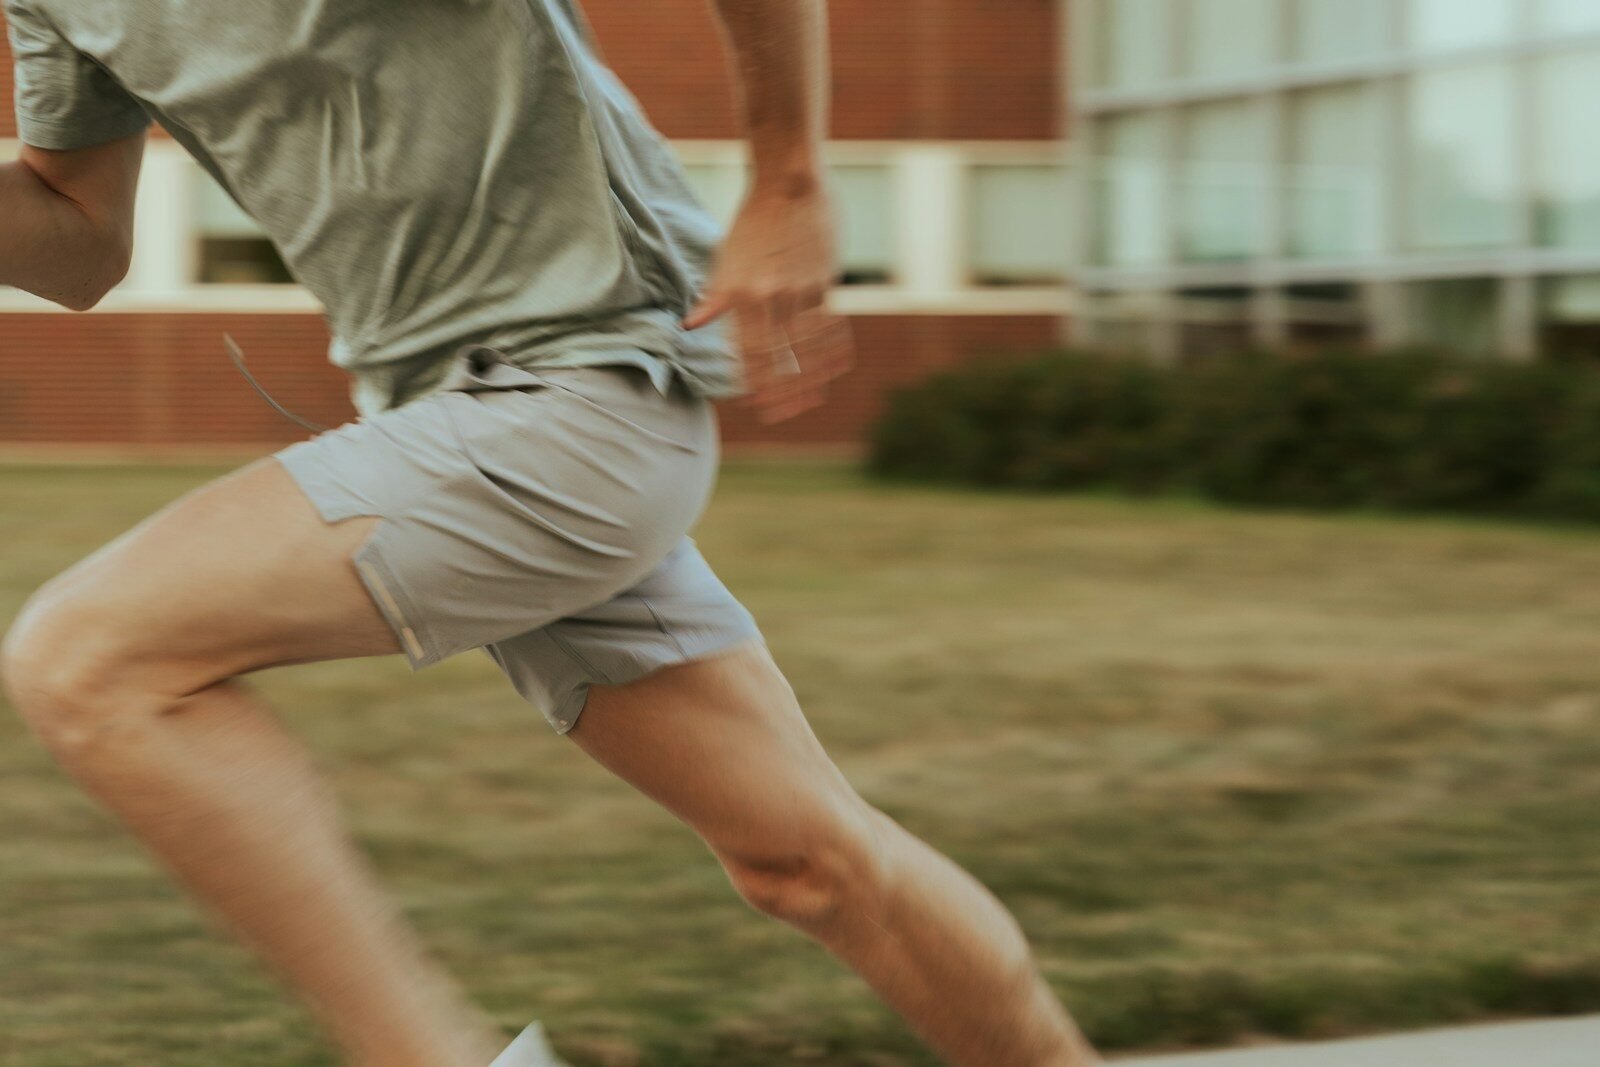
Uphill running increases glute and hamstring EMG recruitment while reducing patellofemoral joint shear stress by up to 30%. Review grade-specific metabolic equations.

Is a 1% incline on a treadmill really necessary? Laboratory indirect calorimetry data reveals exact velocity thresholds where grade offset matches outdoor air resistance.

Running generates 3.5 to 5.0x bodyweight in knee joint contact force, yet recreational runners have lower osteoarthritis rates than sedentary peers. Review MRI cartilage data.

Do carbon plates and PEBA super-foams benefit recreational runners? Data across 9:00 to 12:00/mile paces reveals 1.5% to 2.8% economy gains and muscle protection benefits.

Laboratory metabolic chamber testing proves every 100g of shoe mass adds exactly 1.0% to energetic cost. Explore the physics and data behind footwear weight.

Biomechanical analysis of vertical oscillation (bounce) shows every 10mm excess increases metabolic energy waste by up to 4%. See Garmin running dynamics benchmarks.